

Ask your network
Telemetry, decoded.
 Flow Collector
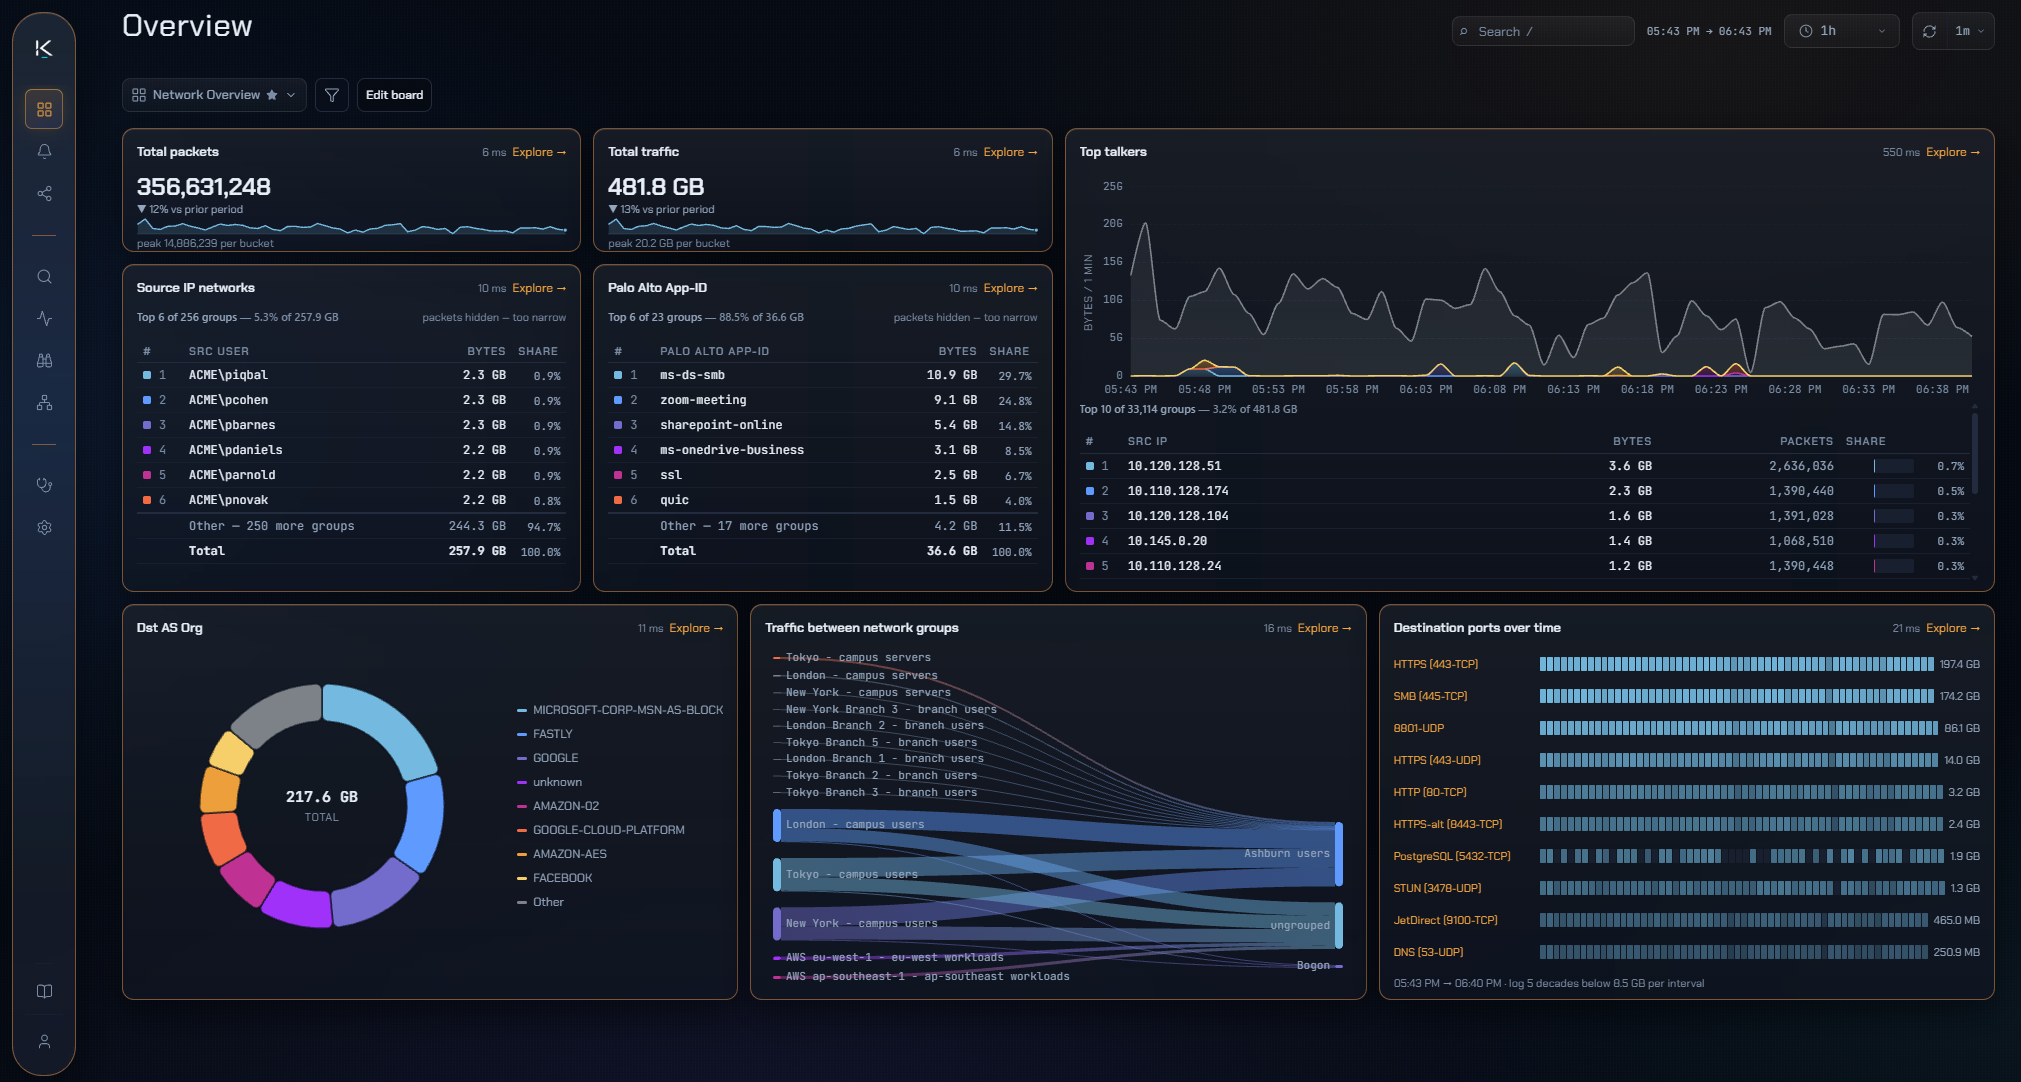
Decode your network telemetry with a powerful and modern traffic analysis solution.
-
Decode
One of the widest libraries of vendor-native exports, so the fields your gear already sends arrive with their names still on them.
-
SNMP
See which devices are up, how hard each link is working and what the hardware is telling you, beside the traffic that explains it.
-
Cloud
Traffic in your cloud accounts read the same way as traffic on the wire. A path from a user to a workload is one story, end to end.
-
Explore
Millions of records, one interface. Follow a hunch from a whole network down to a single conversation without writing a query or waiting on a report.
-
Detection
Know about the slow link or the odd talker before the tickets start. Notice lands where your team already works: SIEM, ticketing, email or chat.
-
Topology
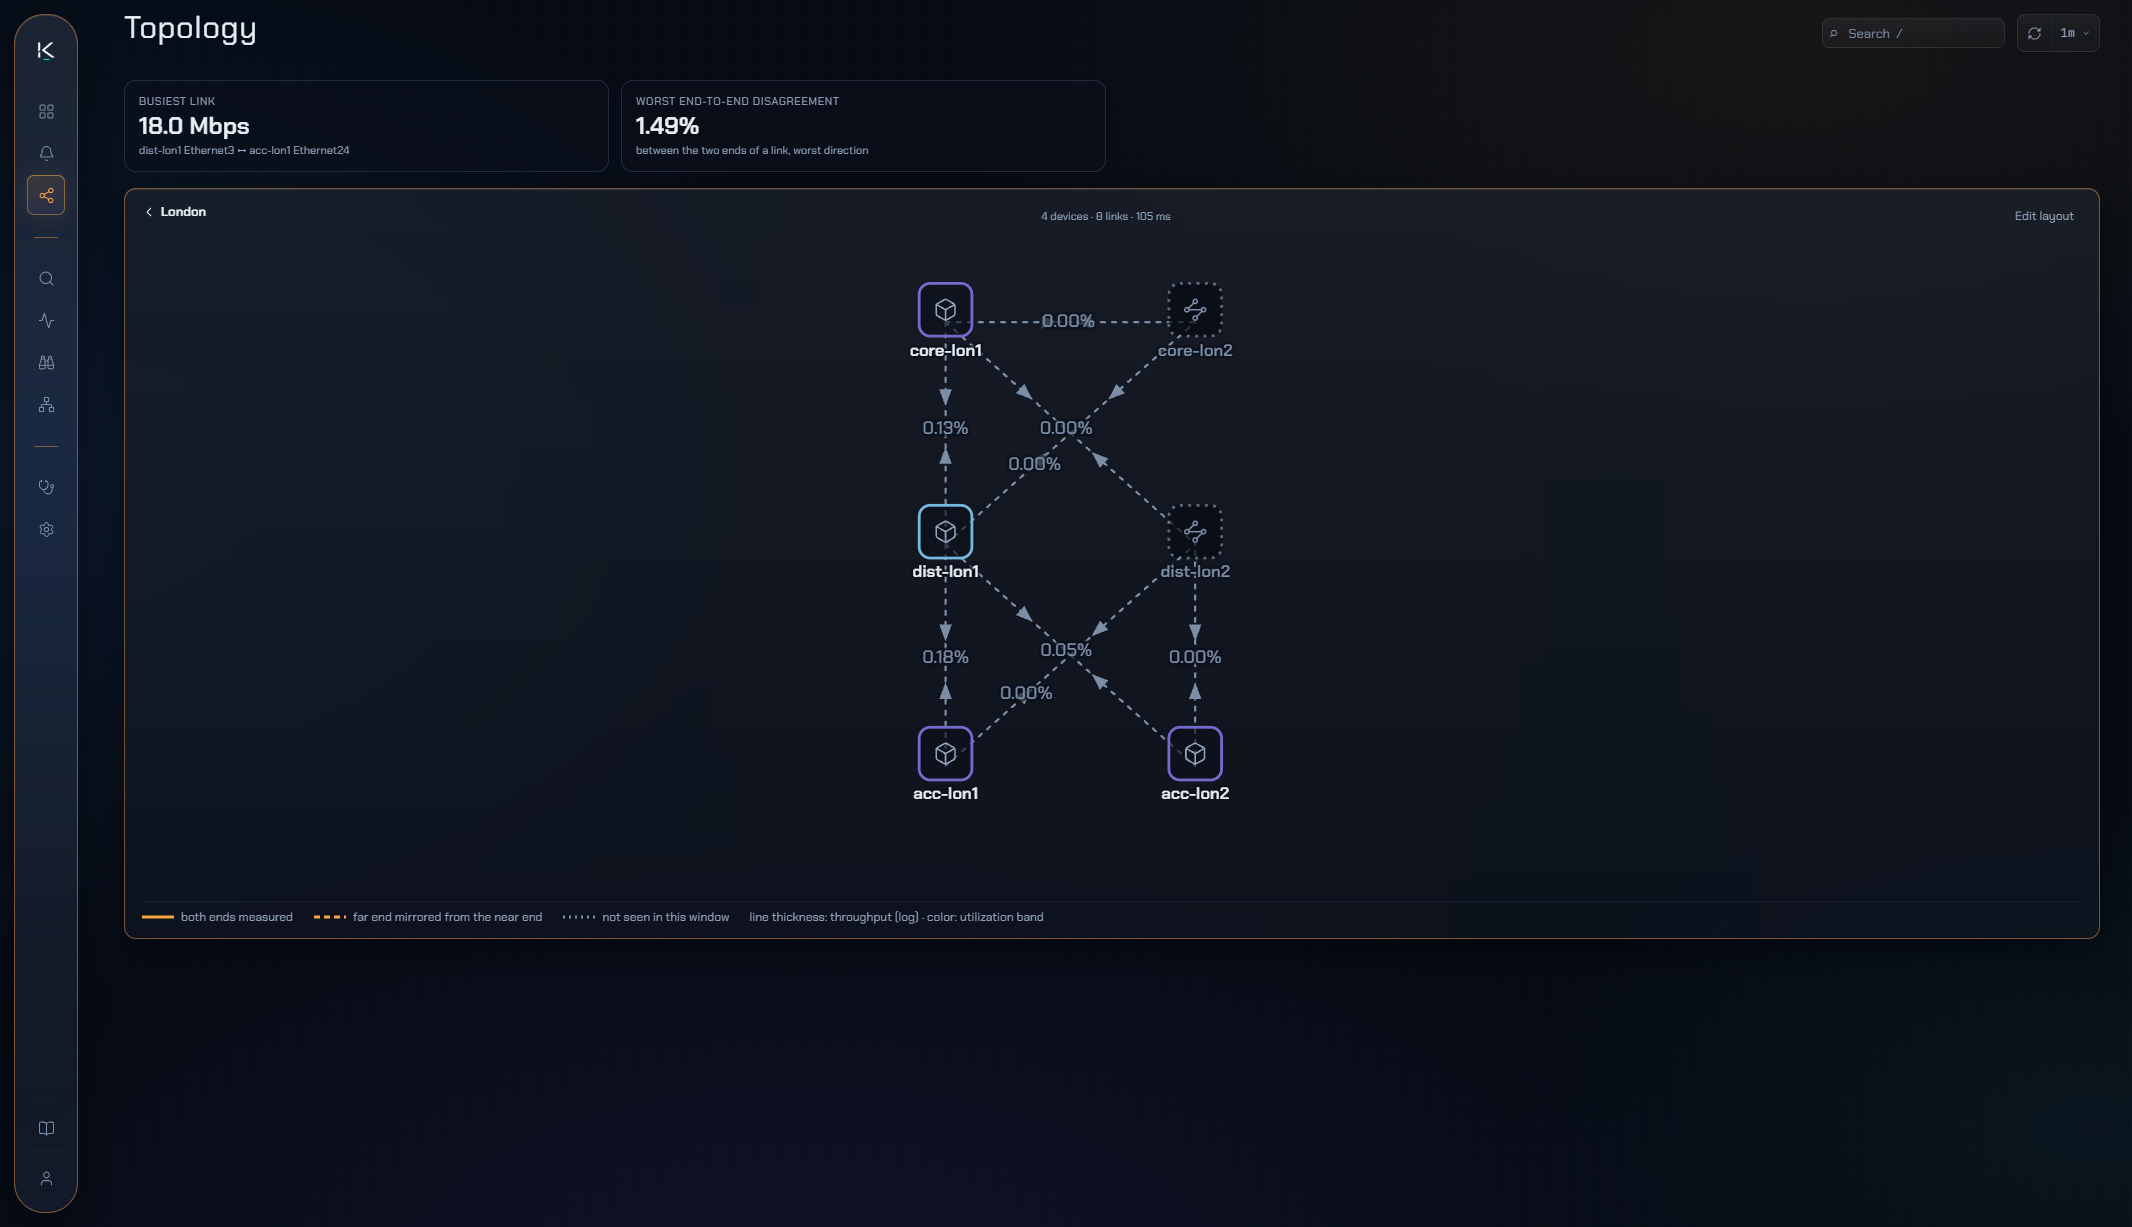
See how the network is actually wired and which way traffic really goes. A change becomes a decision you can defend.
Your equipment is already describing itself. Most tools throw the description away.
Decode
Get the full value of telemetry you already pay for
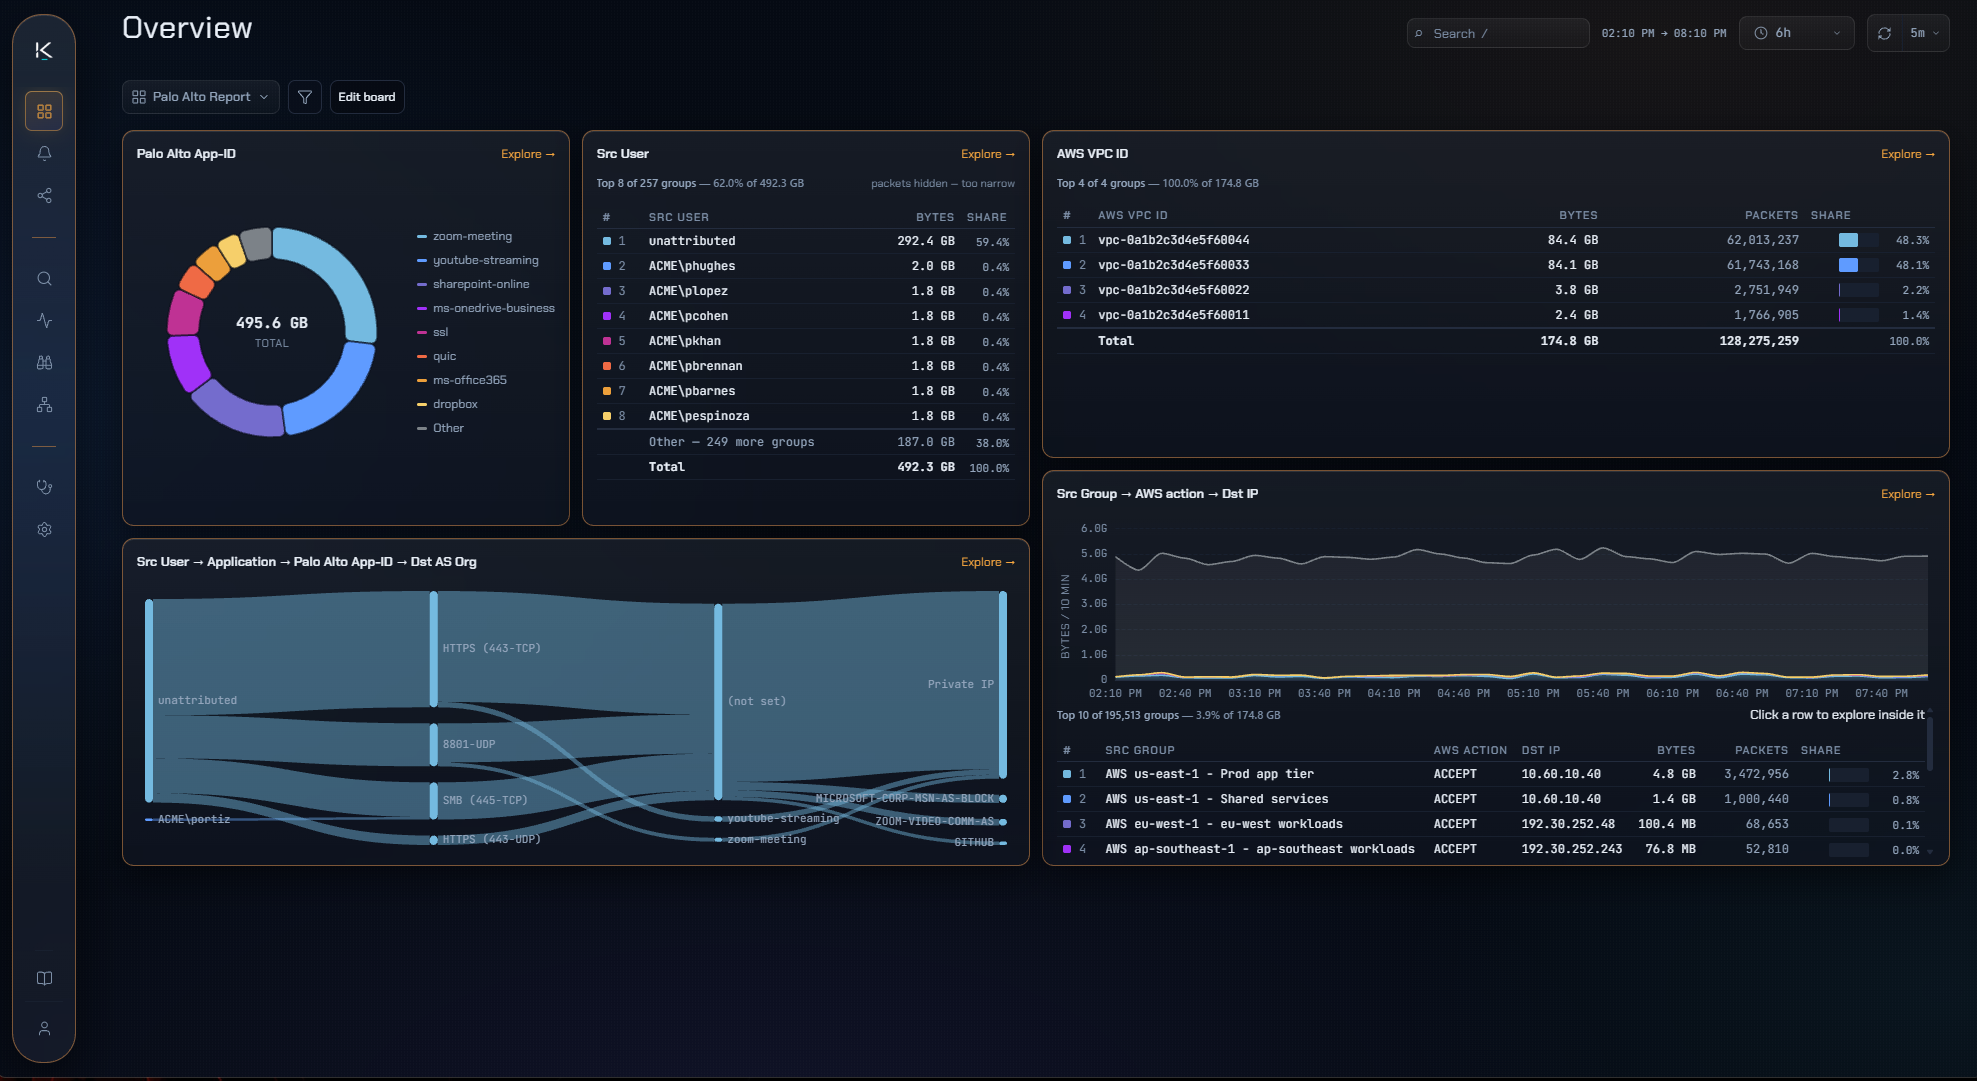
Modern exporters send far more than addresses and byte counts. They tell you who the user was, which application it really was, and which policy let it through. Flow Collector reads one of the widest libraries of vendor-native exports available, so that detail arrives as something you can rank and act on.
- Named, not numbered — a vendor field arrives as the thing it describes. A username stays a username all the way through.
- Nothing to give up at the source — keep the exports your team already tuned. Nothing gets reduced to a common denominator.
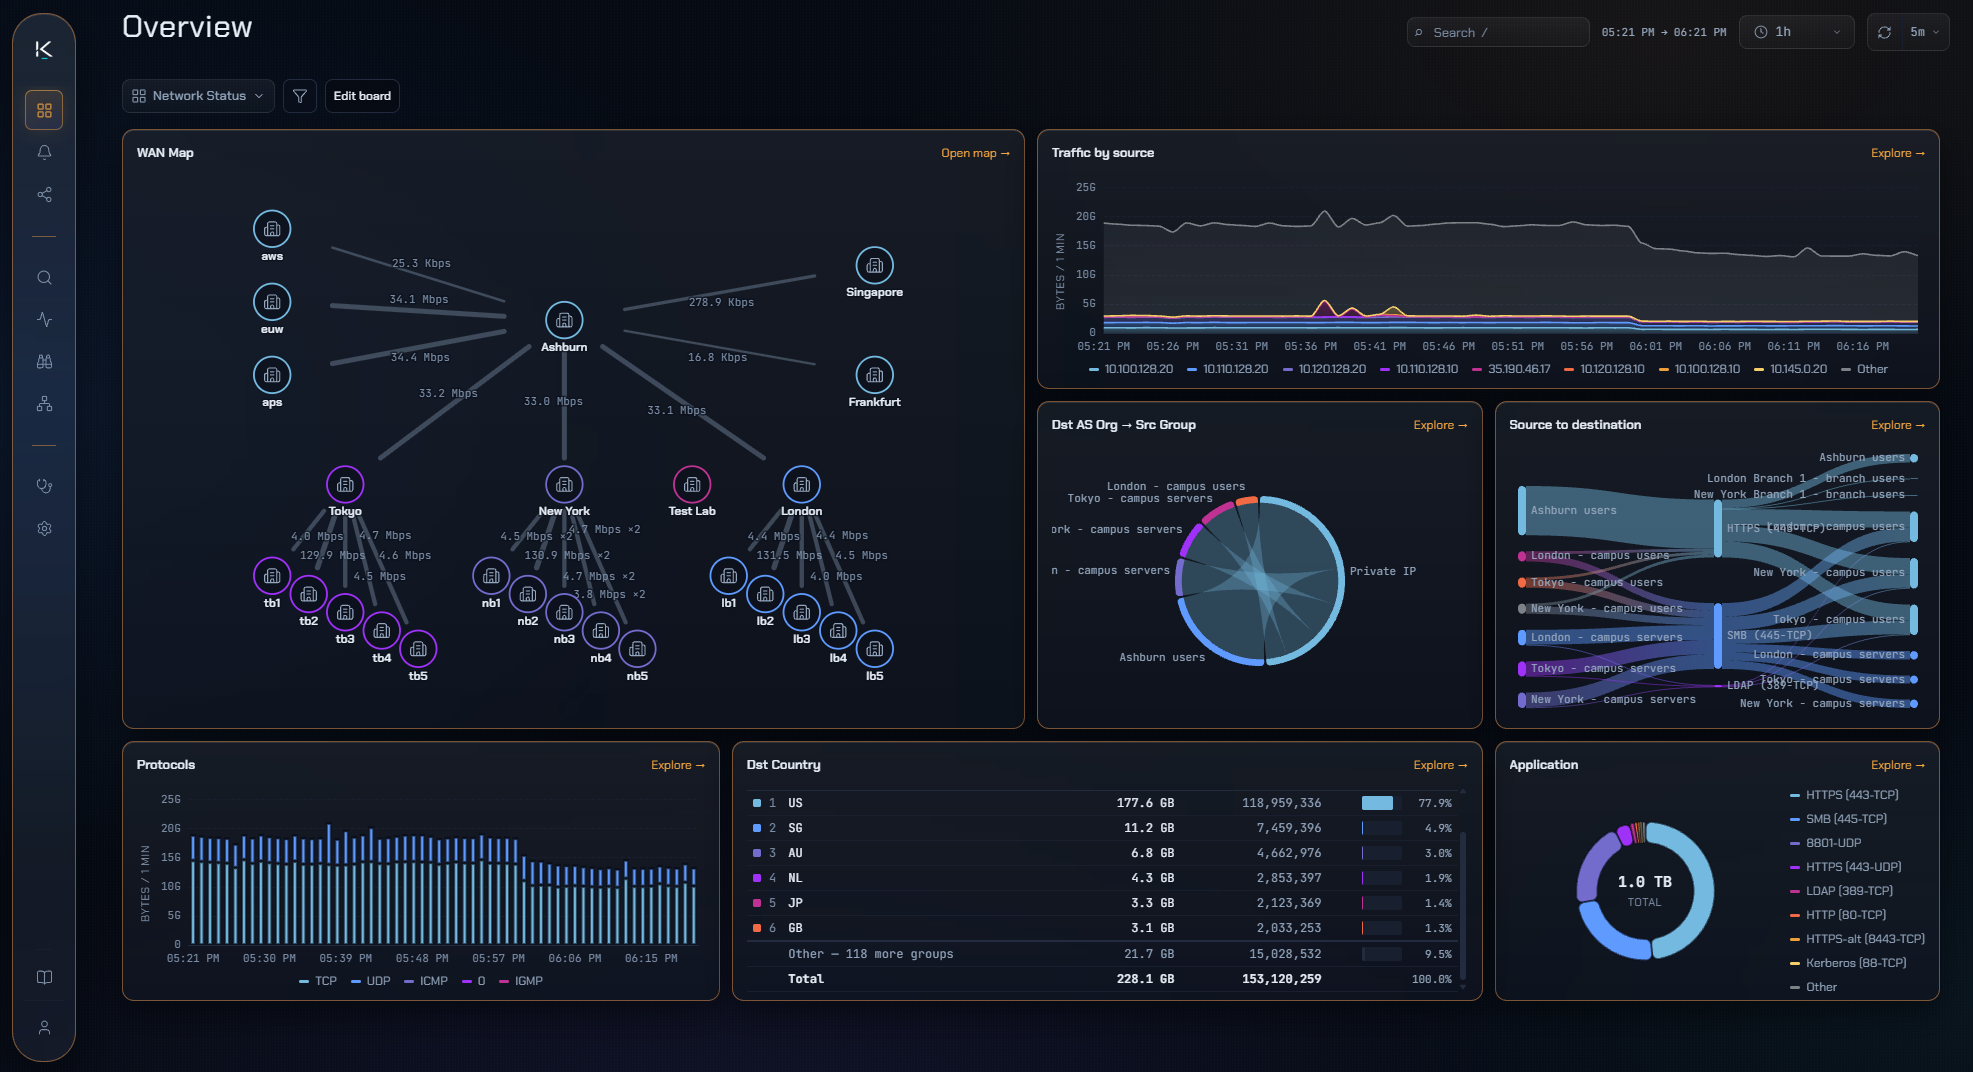
The link looks fine. The box carrying it has been quietly failing since Tuesday.
SNMP
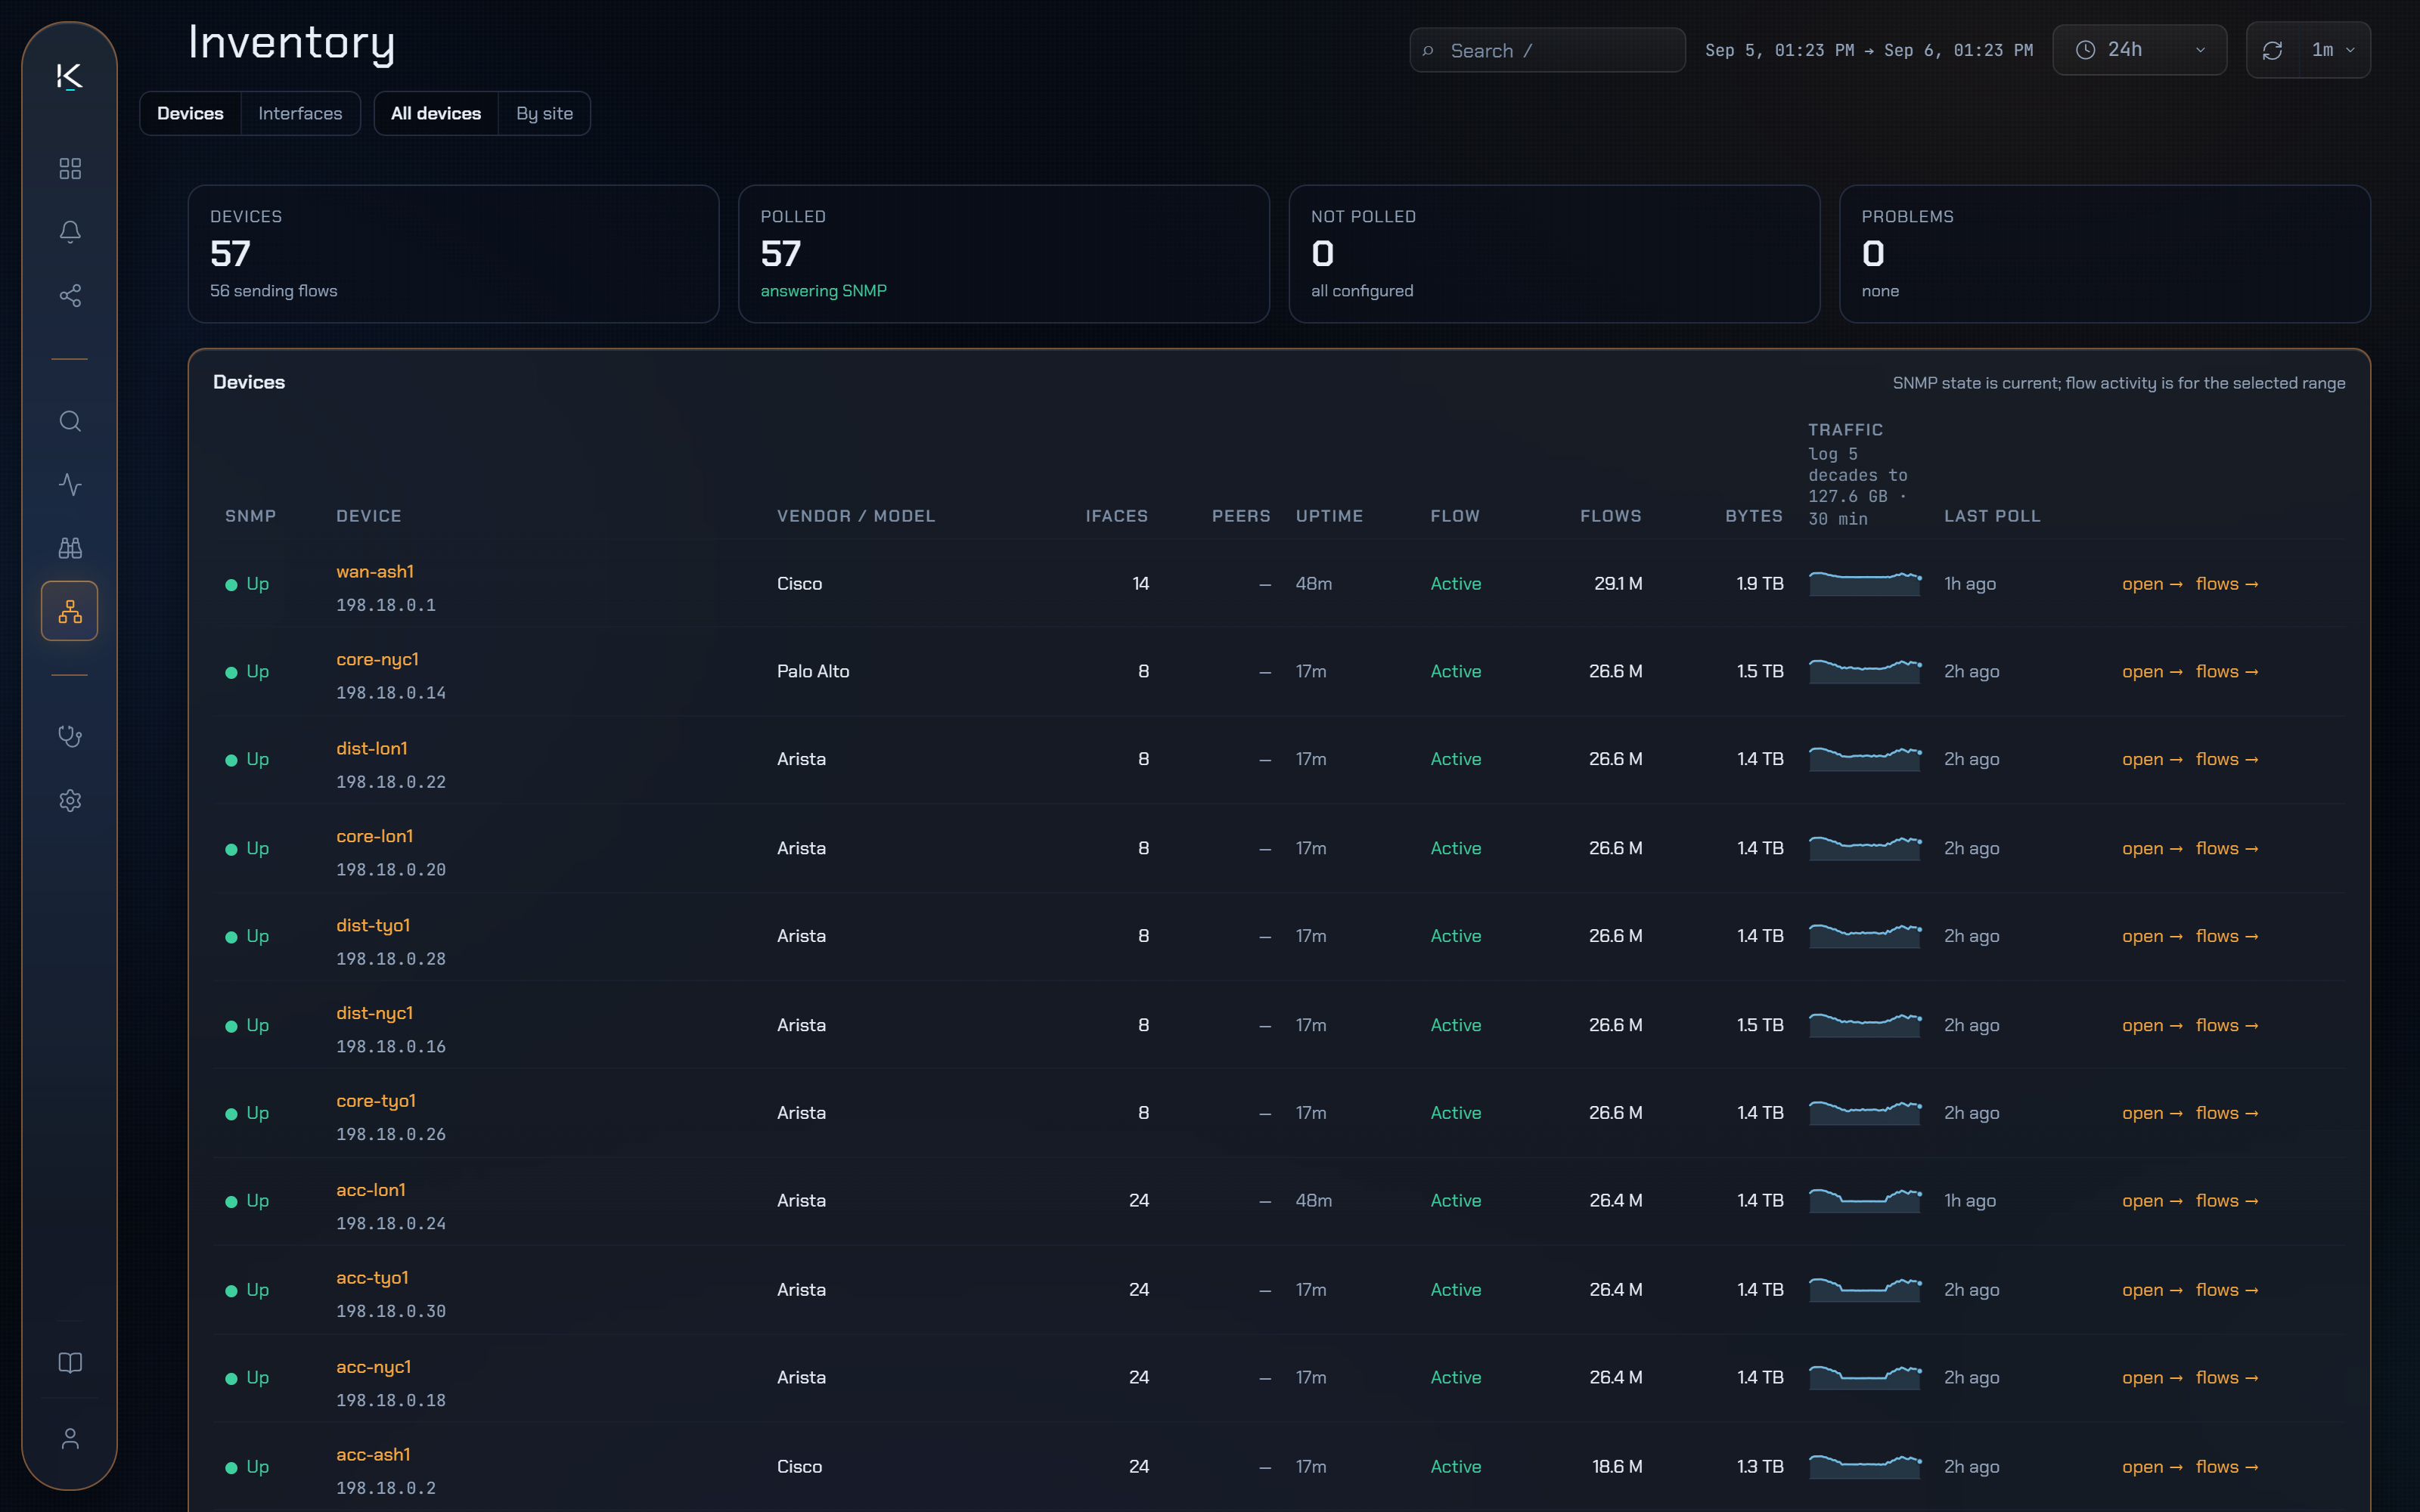
See the traffic and the box that is carrying it
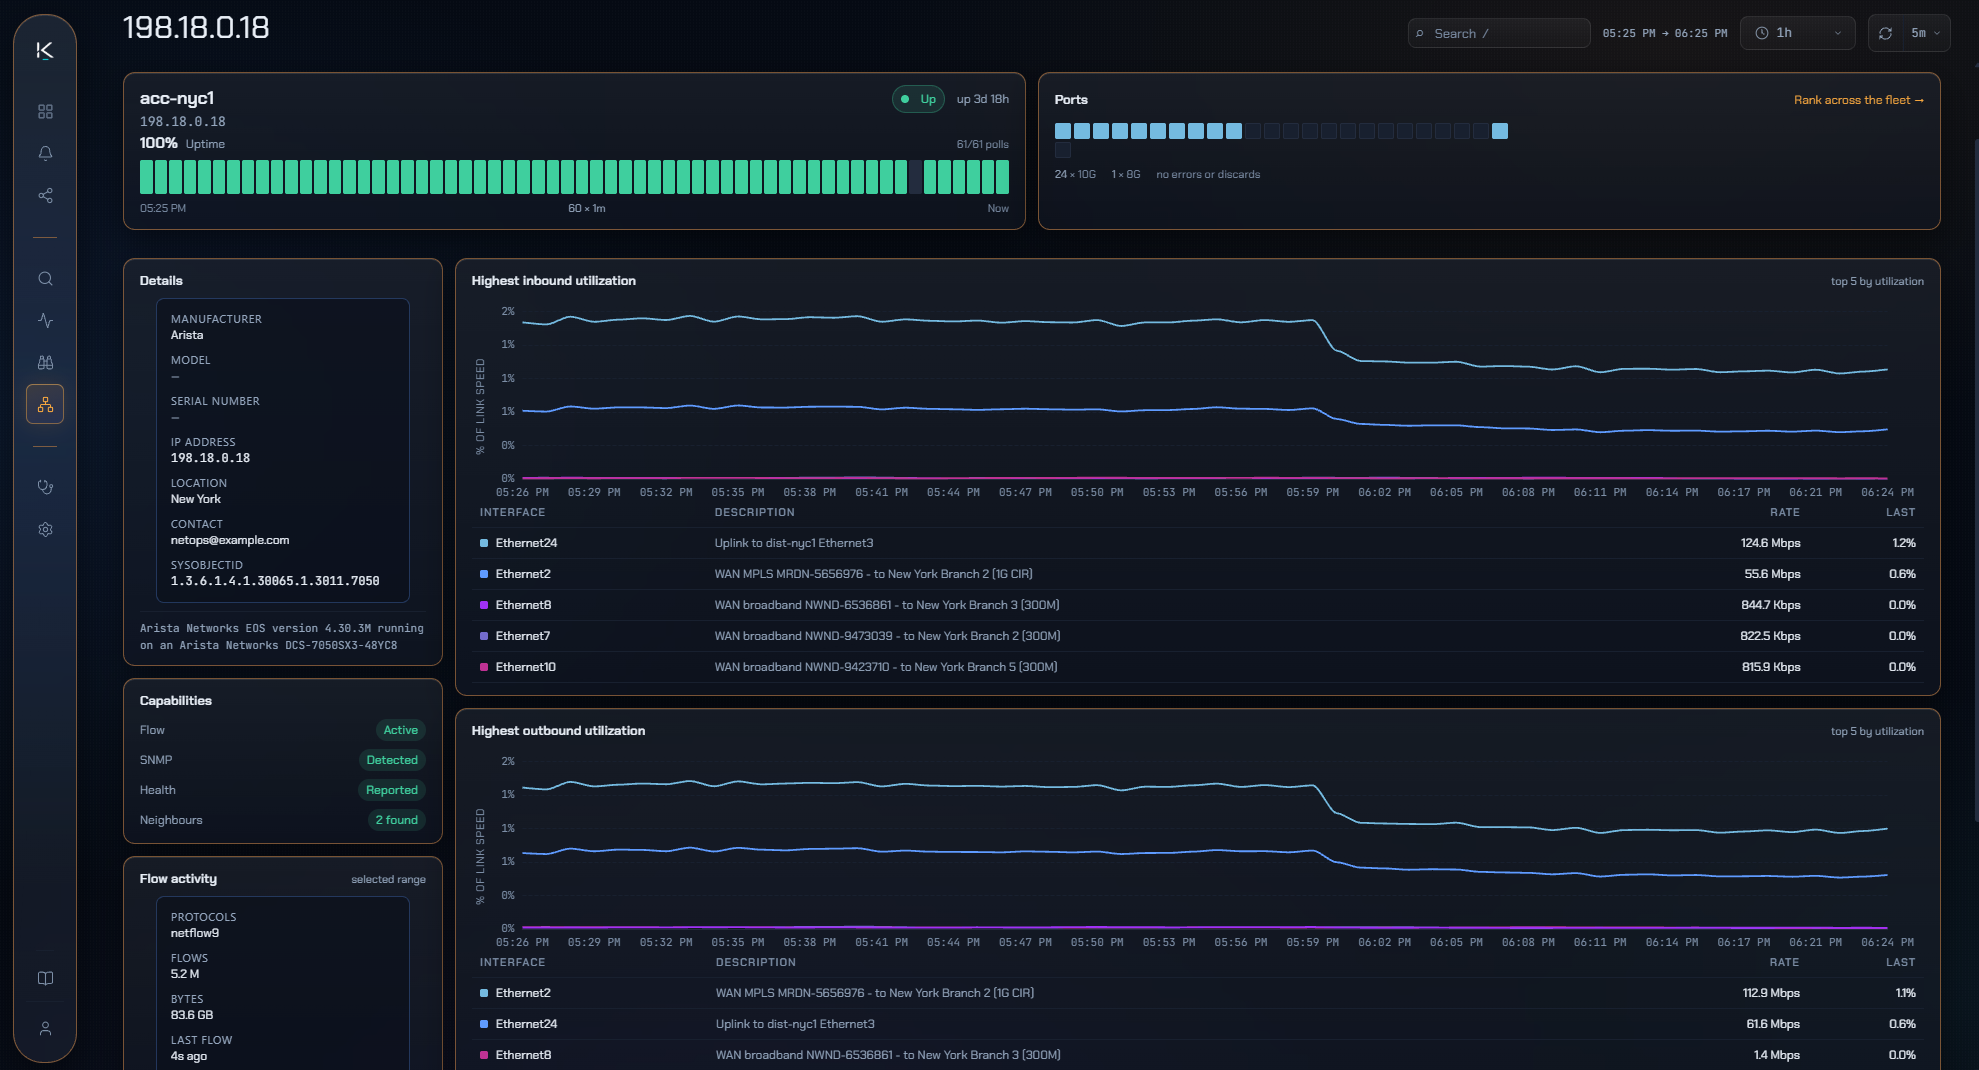
Traffic tells you what moved. The device tells you whether it can keep moving it. Flow Collector brings both together in one place. A traffic spike and a struggling interface appear on the same screen, so you can see whether they are related.
- Up, down, and how hard it is working — see reachability and utilization for every device and every port, both over time and right now.
- One solution for traffic and device health — see NetFlow traffic and SNMP device performance together, without maintaining separate tools for each.
The complaint crosses your datacentre, your cloud, and the seam between them.
Cloud
Follow the whole path, not the half you own
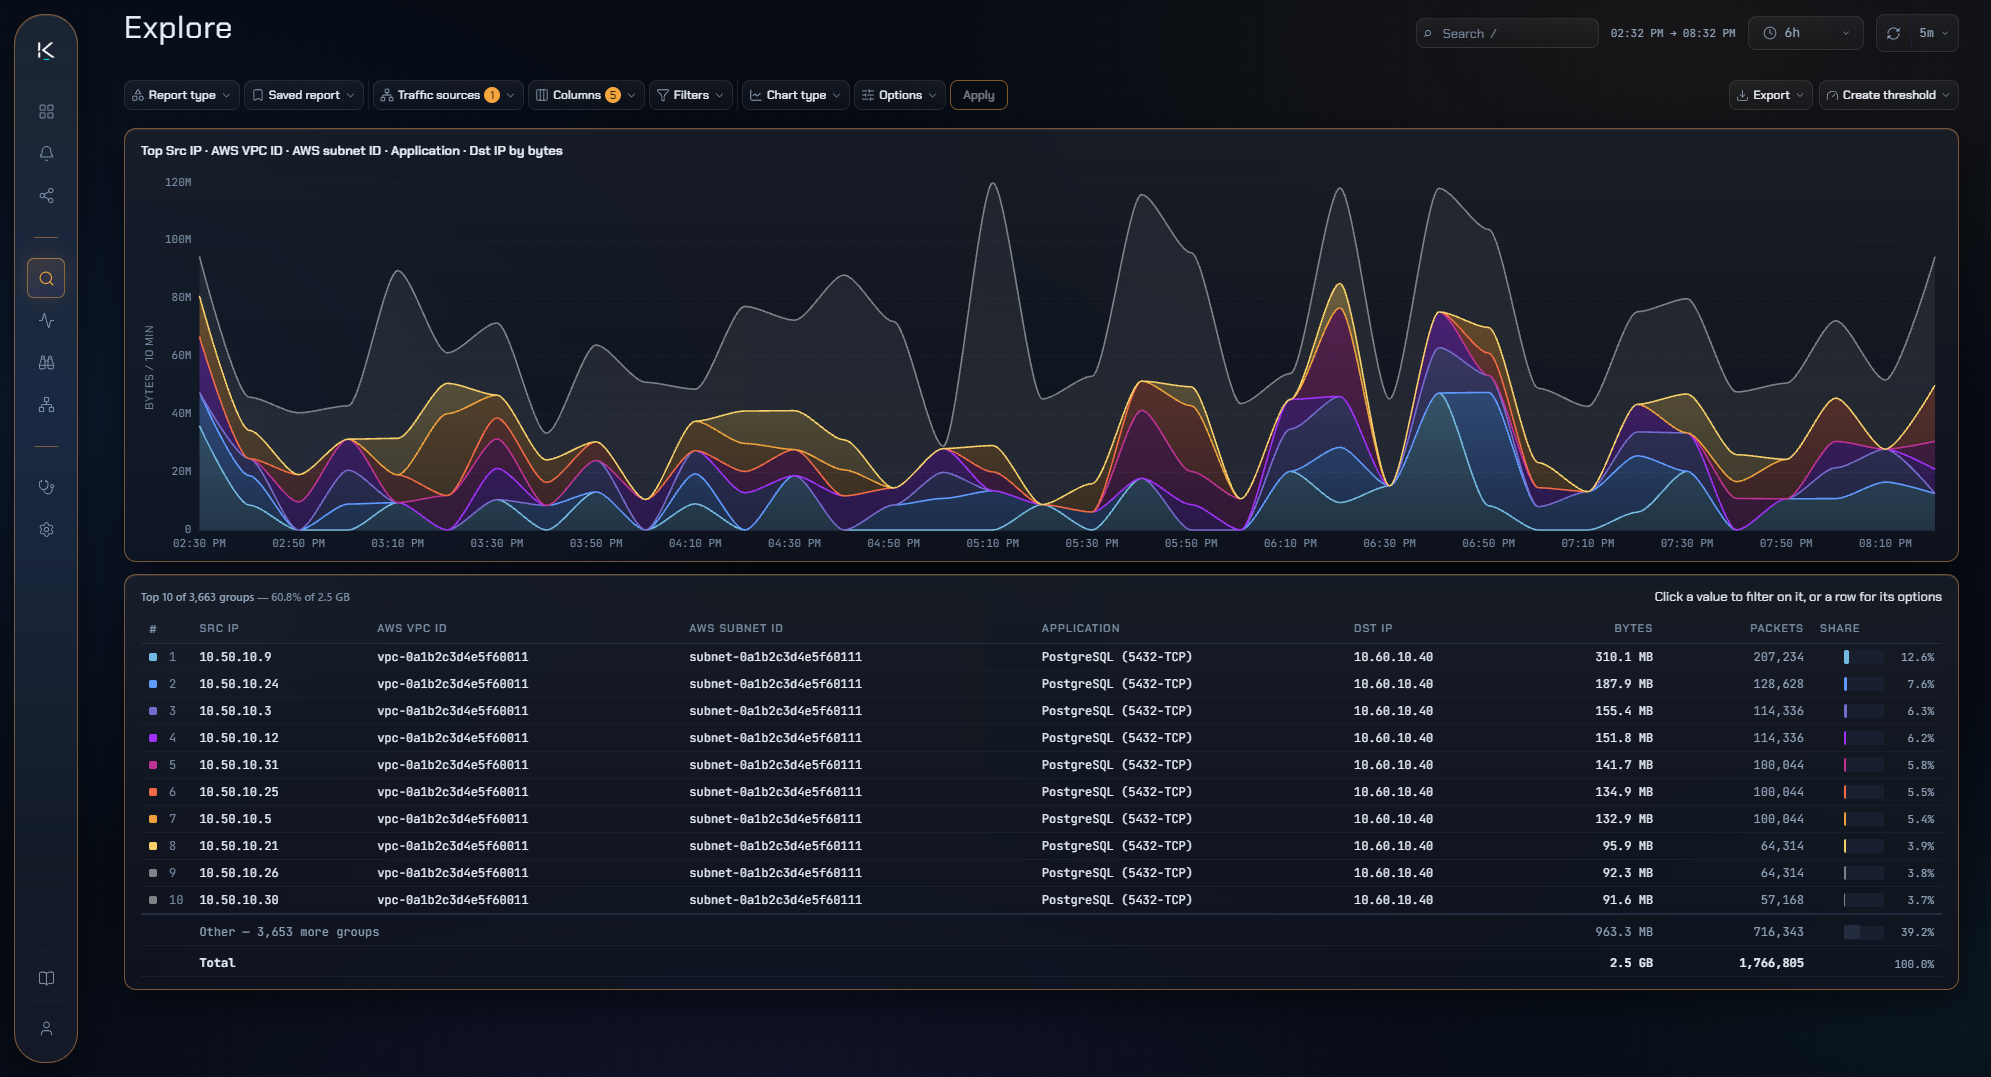
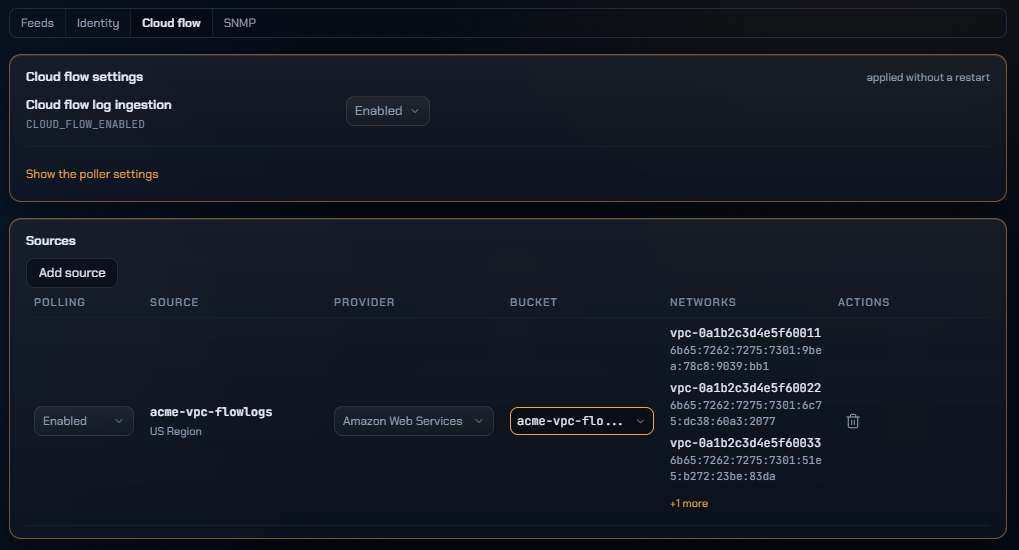
Workloads moved; visibility mostly did not. Cloud traffic is collected and read exactly like traffic from the wire, so troubleshooting a user's route to an application is one investigation end to end, with nothing assumed in the middle.
- One investigation, wherever it leads — the same views and filters apply on both sides of the seam, and so does the history.
- Cloud networks earn their own identity — each one is a place you can name, chart and compare, the way a site is.
A link saturated at two in the morning, and nobody can say what filled it.
Explore
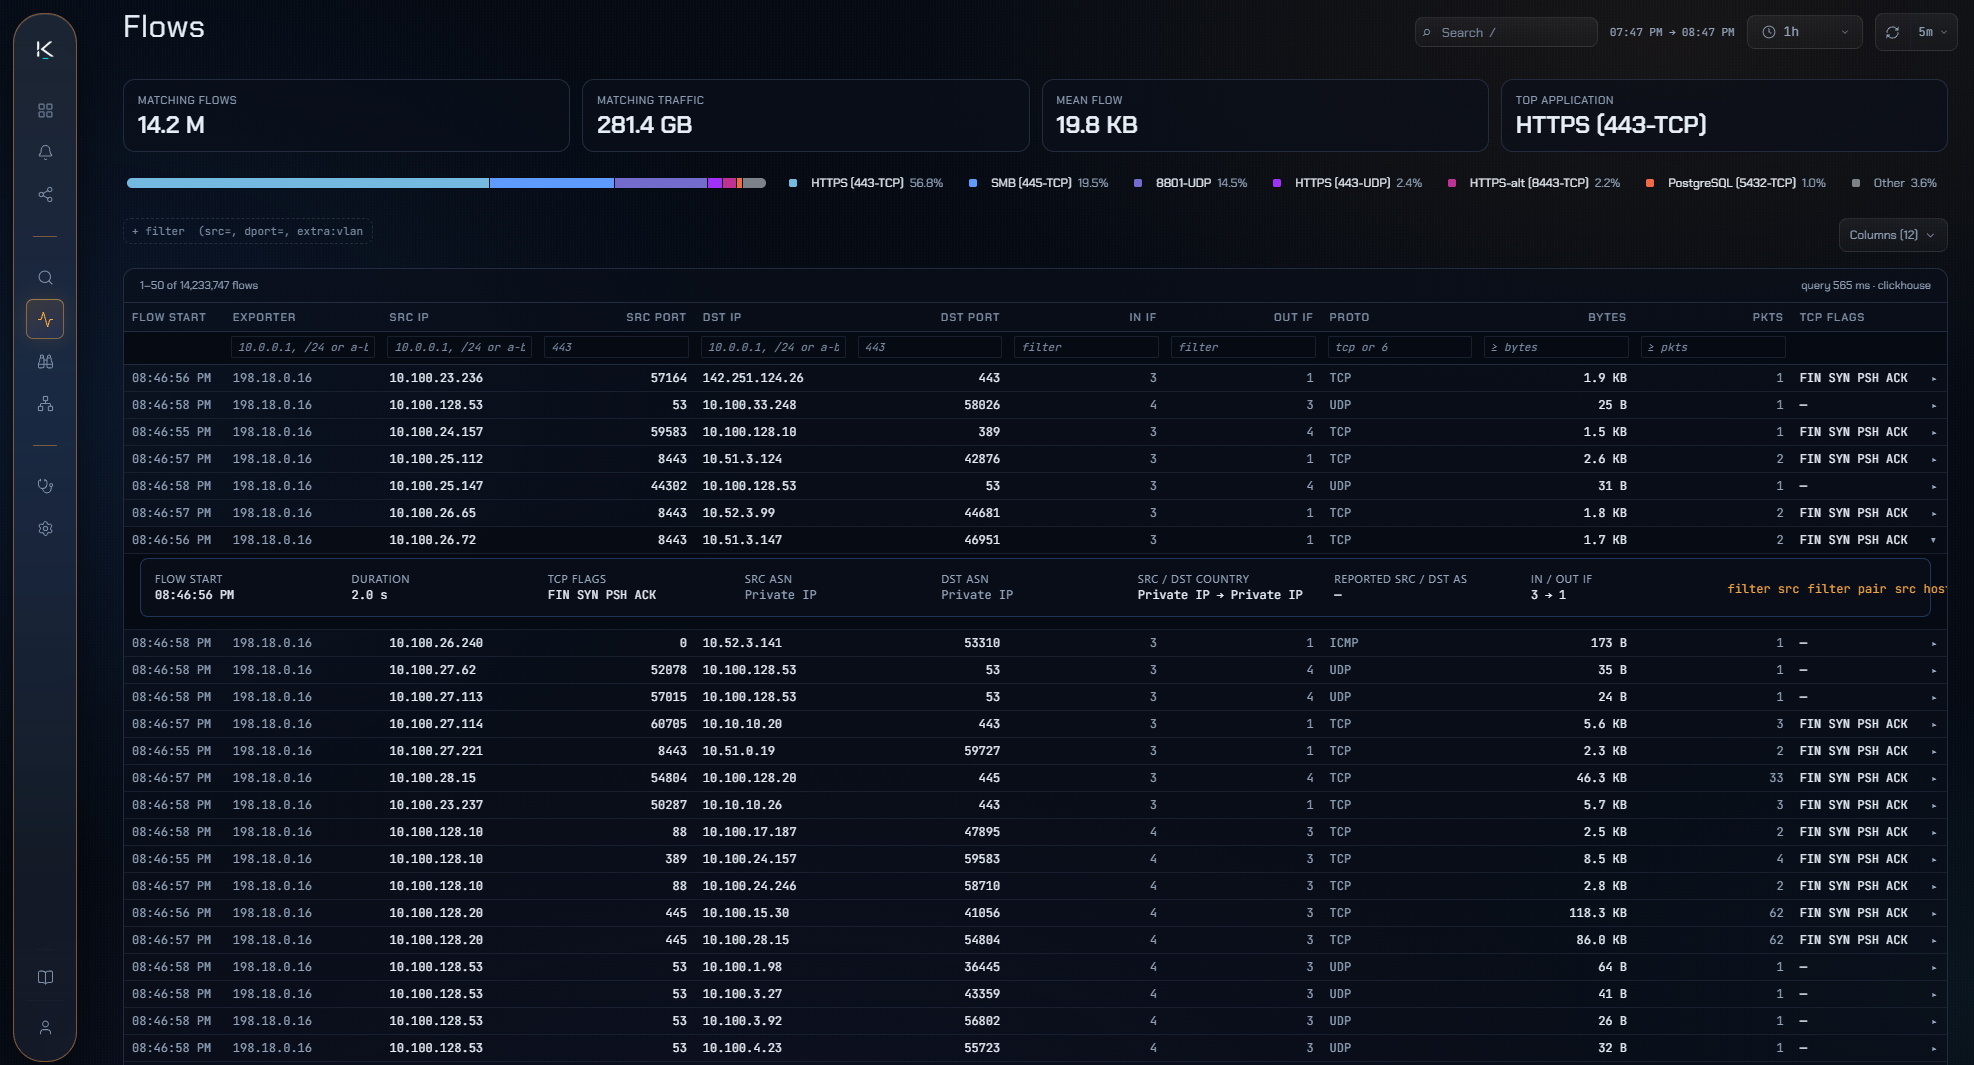
Millions of records, and the answer is a few clicks away
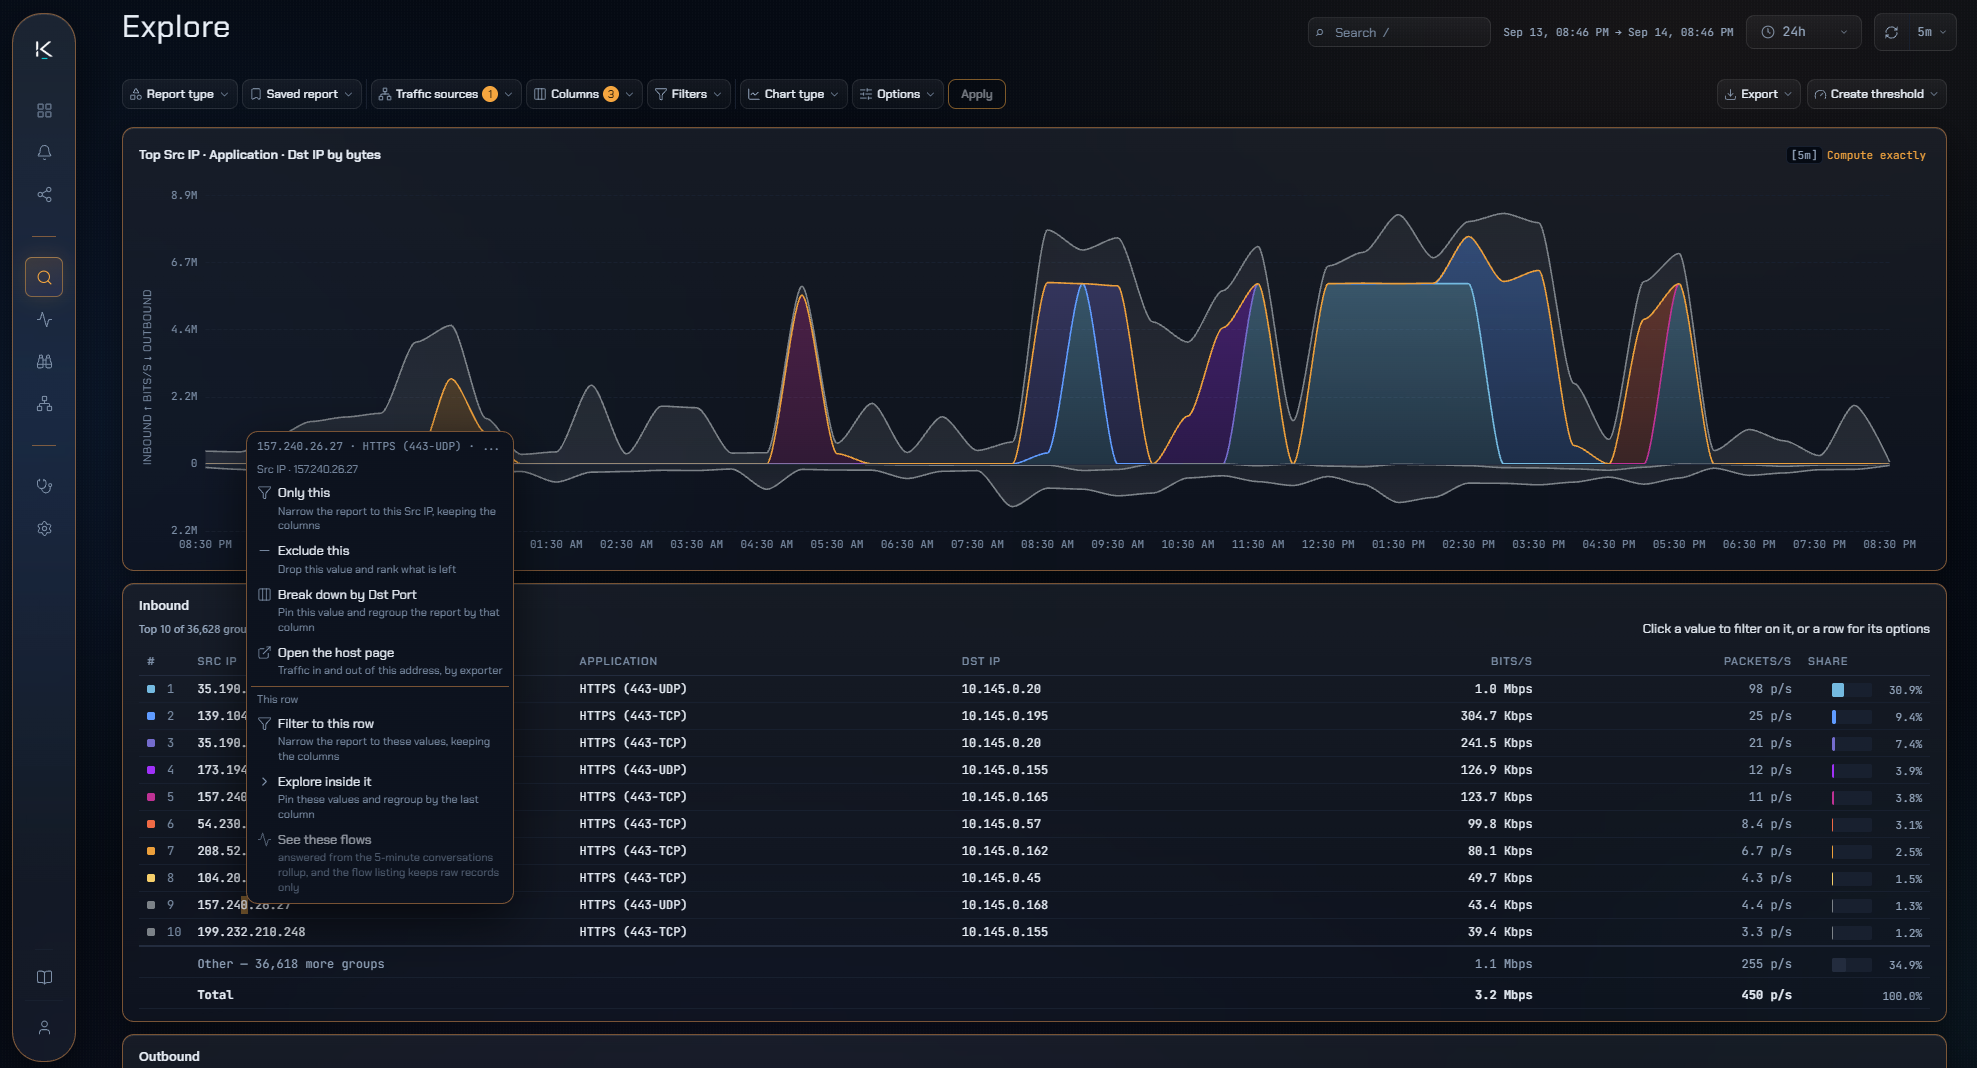
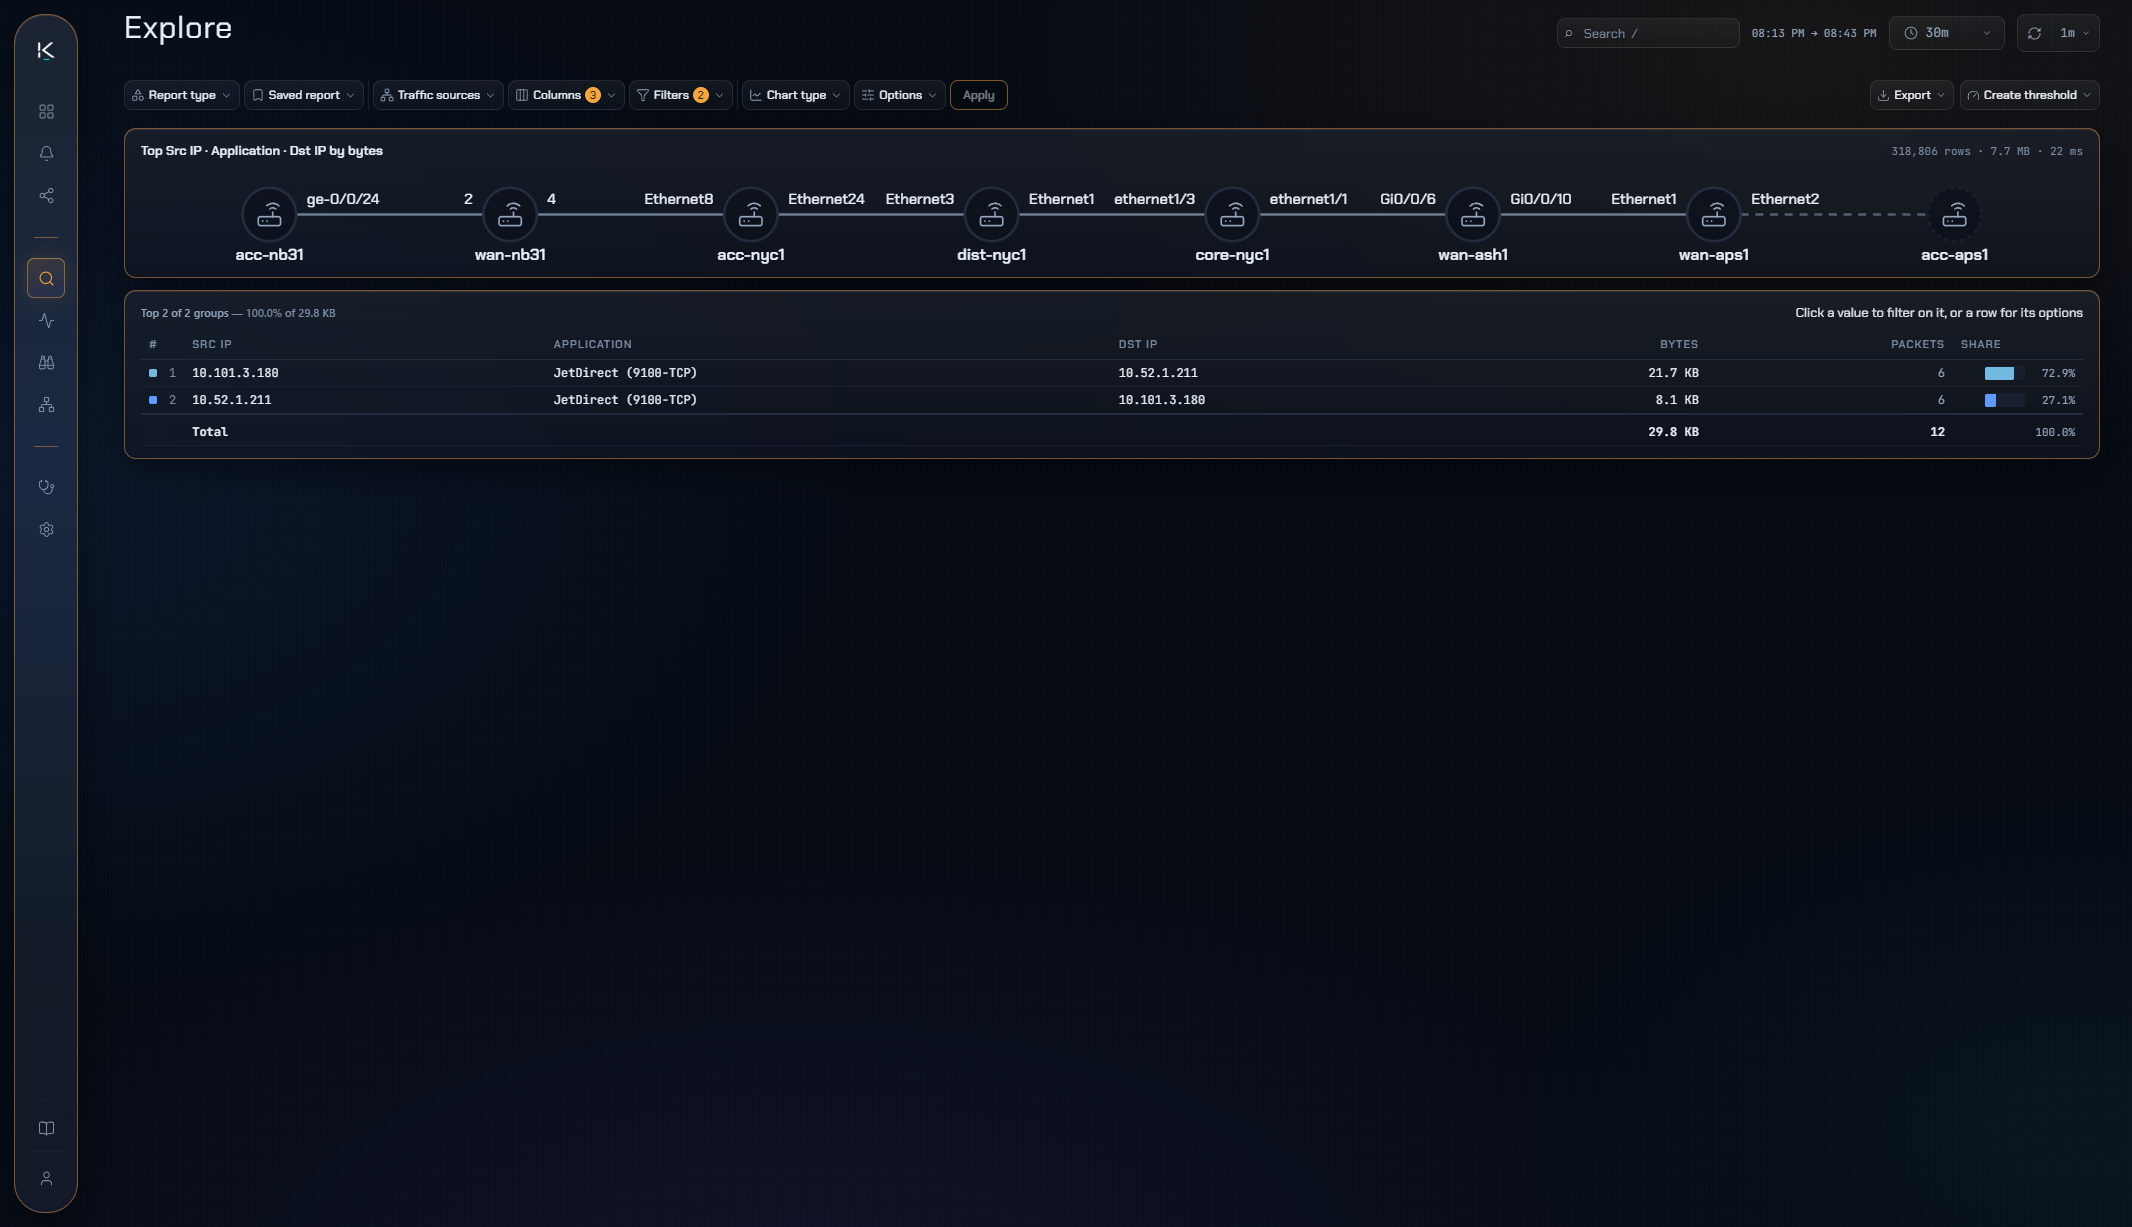
The question is rarely the first one you ask. Move from the whole network to a single conversation by following what looks wrong, without writing a query or waiting on someone to build a report.
- Every answer is the next question — narrow to a moment, a site or a host by pointing at it, and carry the context with you.
- Slice it the way you think about it — by user, application, country, site or port. Whatever the argument in the room actually needs.
- And when the rollup runs out — drop into the individual flow records underneath it.
The outage began forty minutes before the first ticket arrived.
Detection
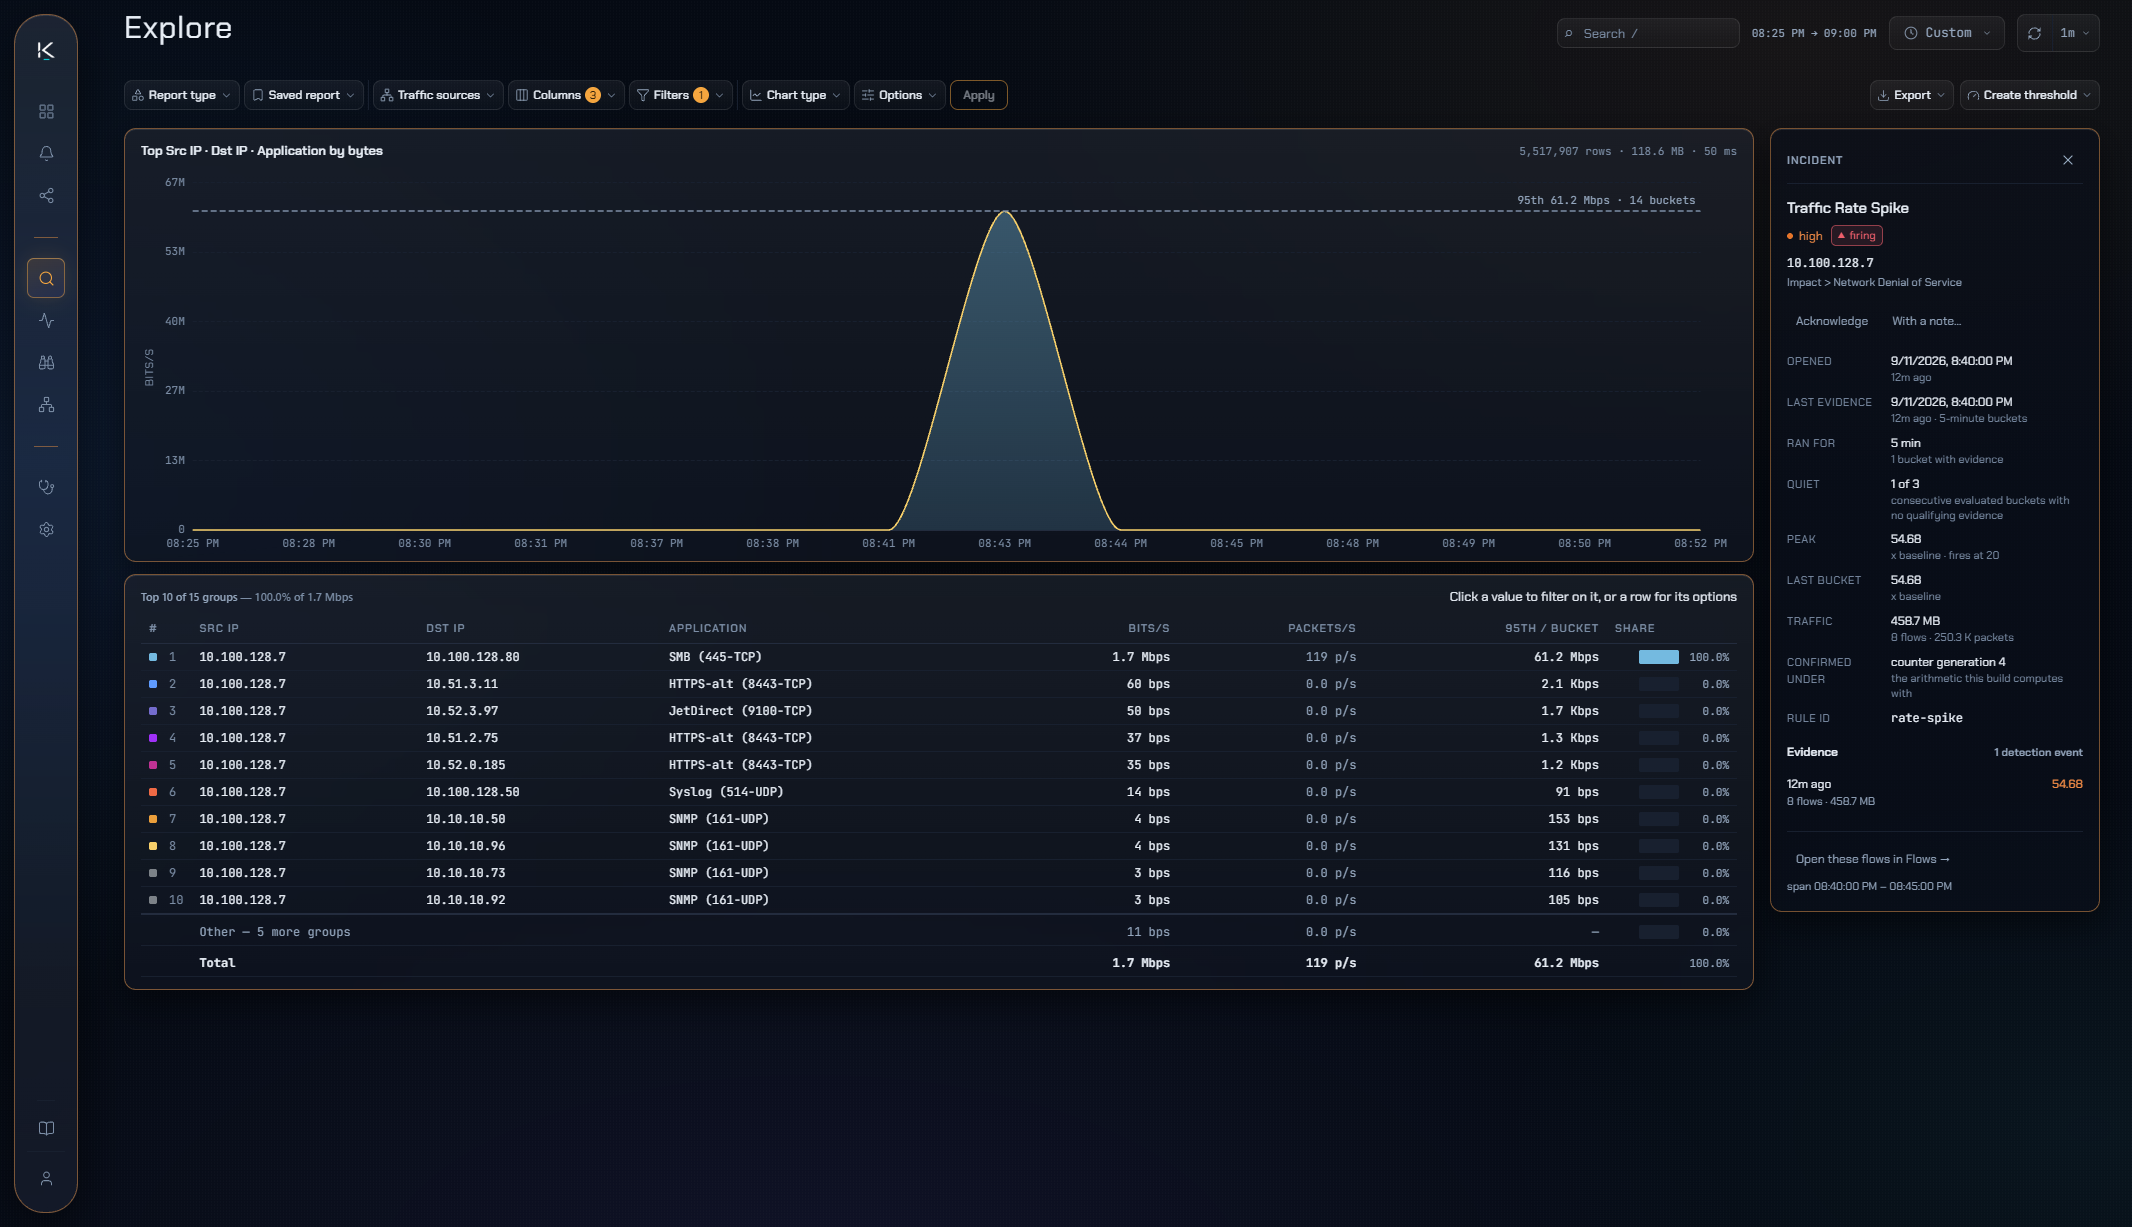
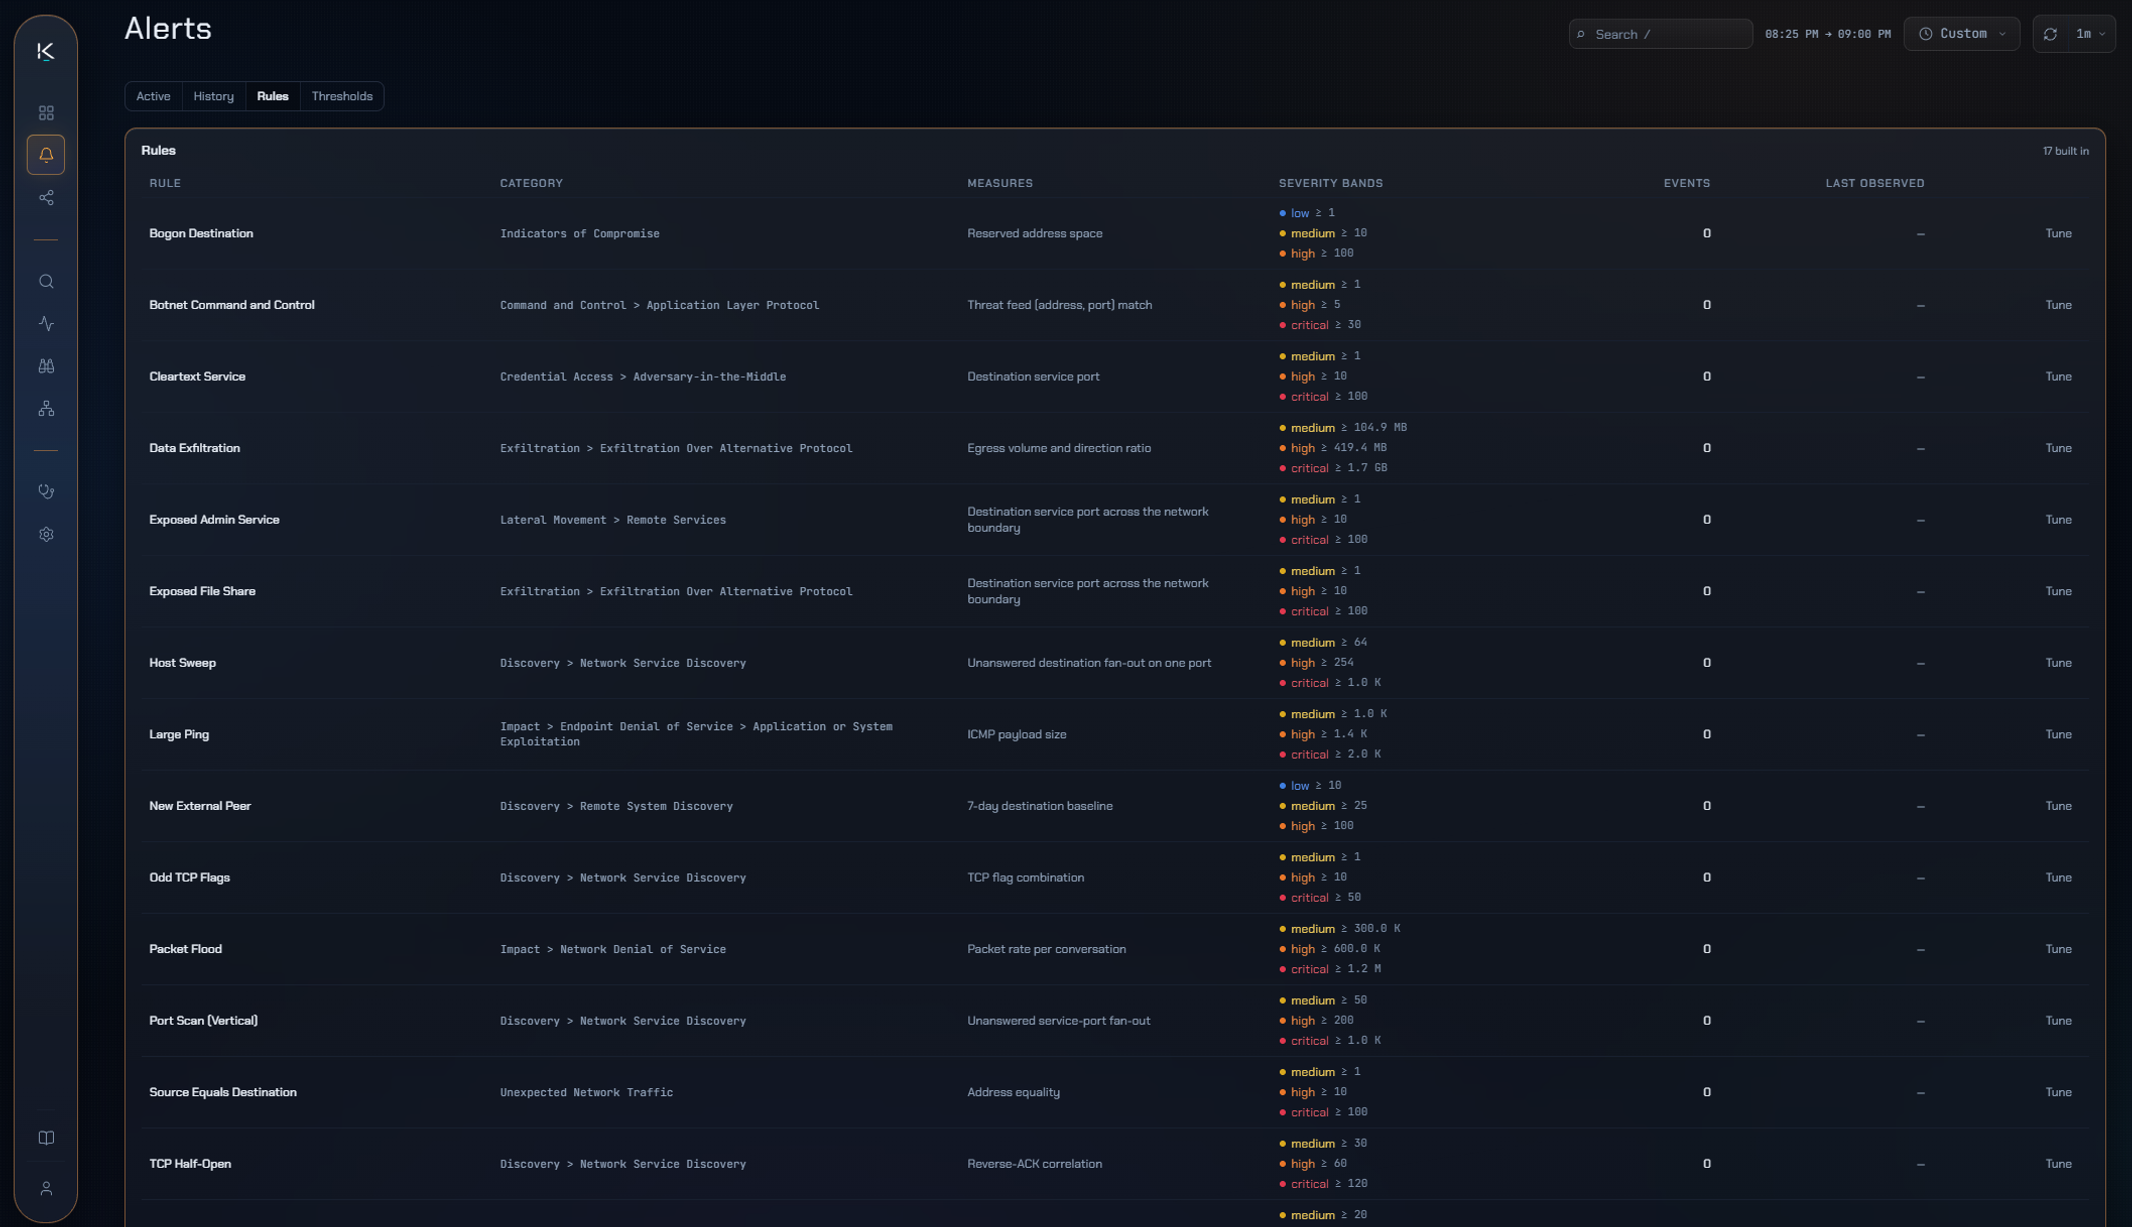
Hear about it before your users do
Performance problems and suspicious behaviour are caught as they happen, and the notice arrives with enough context to act on before you open anything. It reaches your team where they already are — SIEM, ticketing, email or chat.
- Two kinds of trouble, one watchlist — the saturated link and the host talking somewhere it never has are both worth waking up for.
- The evidence comes with it — what fired and who was involved, with the evidence behind it. The first minute is spent deciding.
The diagram on the wall is three changes and two acquisitions out of date.
Topology
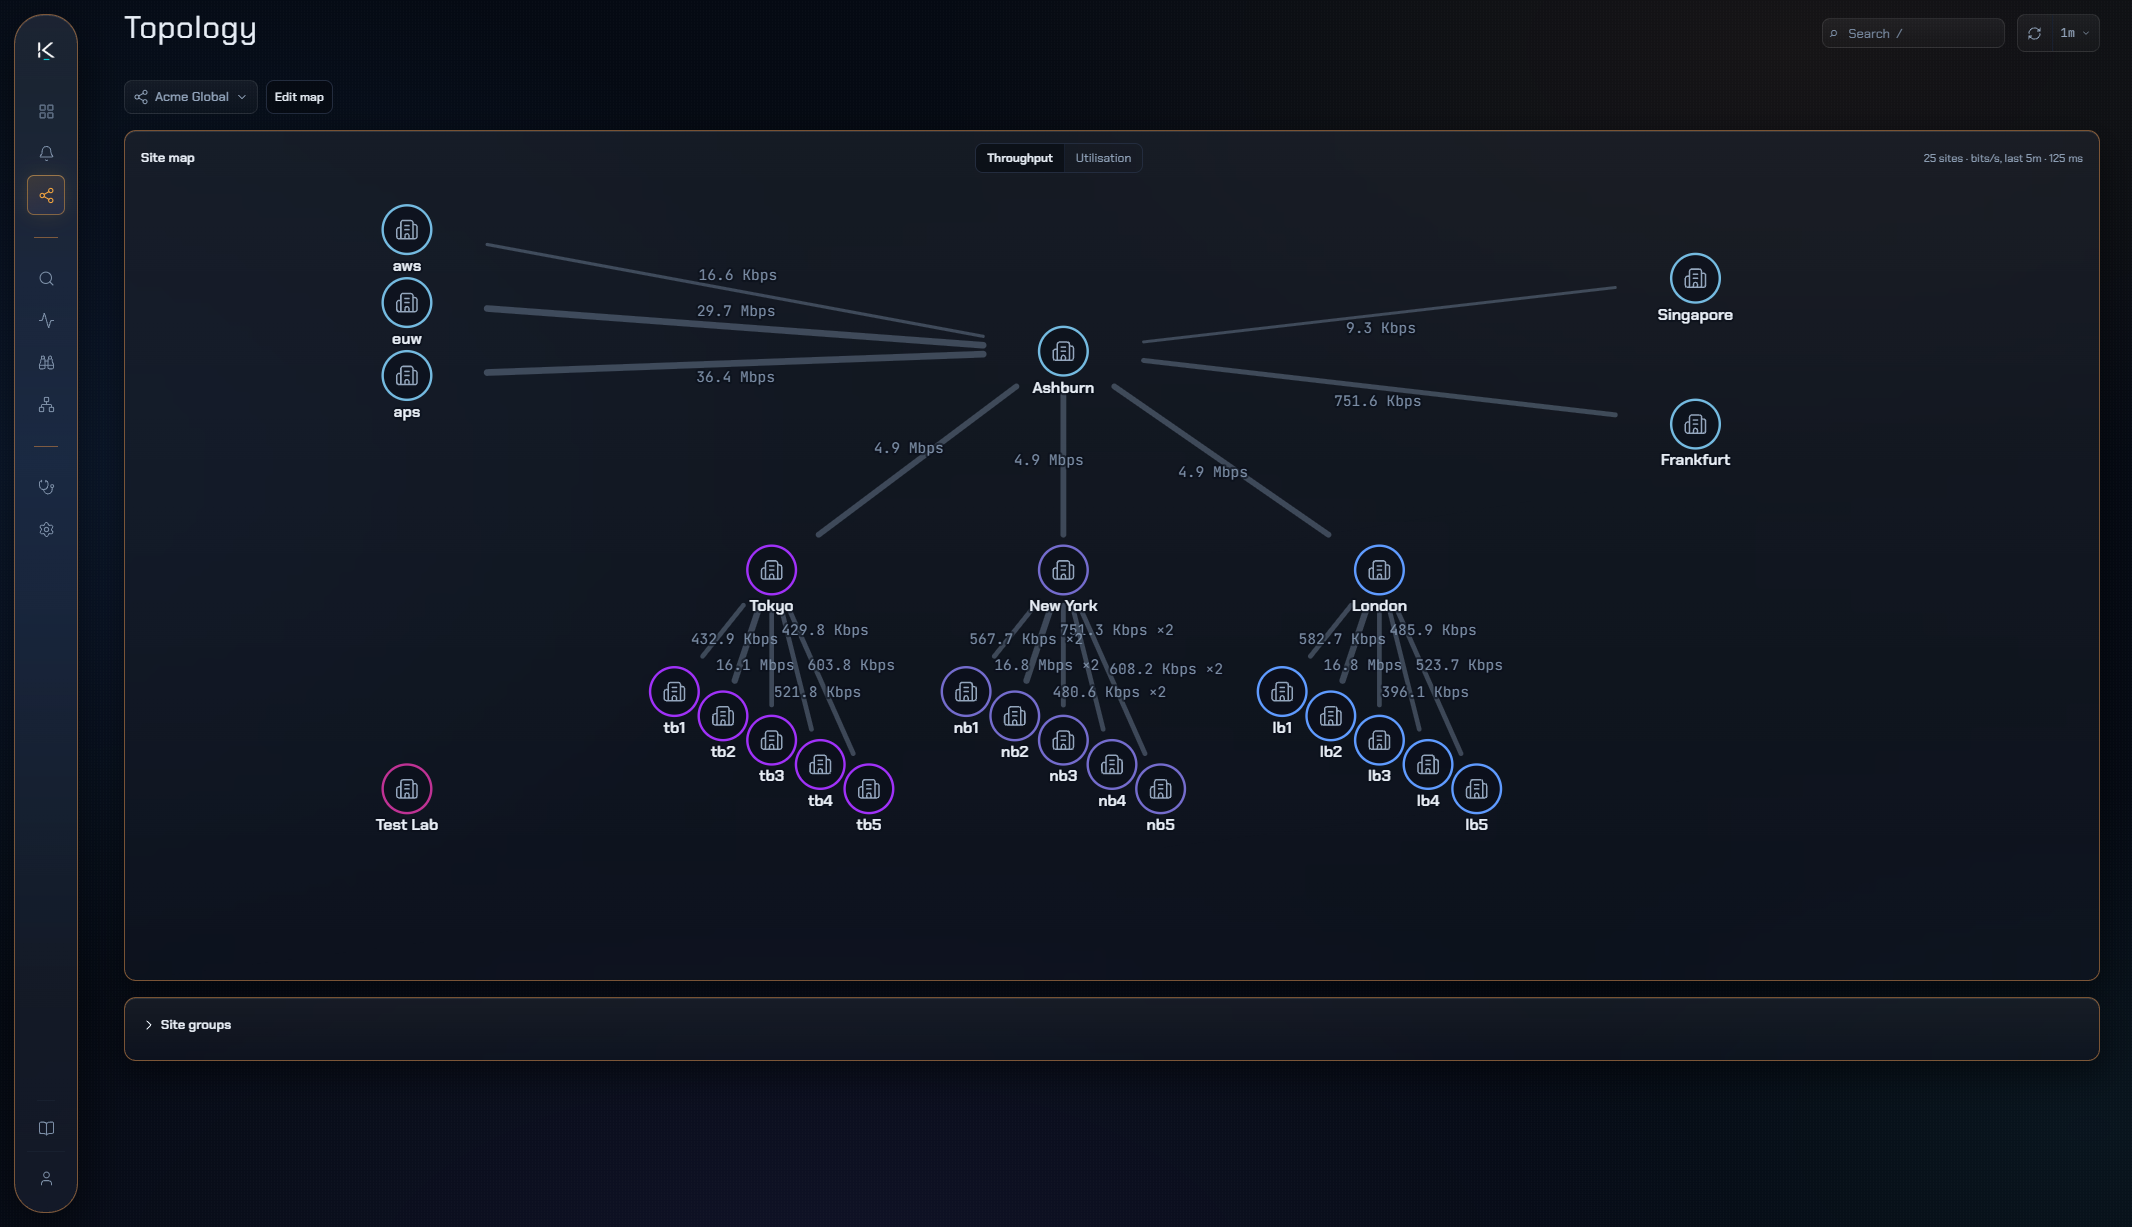
Follow one conversation across the whole network
Your sites and the circuits between them, the devices inside any one of them, and the path a single conversation actually took across both. Enough to plan a change or size a circuit. Or settle the argument about which way traffic really goes.
- Drawn from the equipment itself — connections and the rates on them come from the devices, and you can follow one conversation hop by hop through every device it crossed, on your own floor and in the cloud alike.
Who this is for
Four kinds of network, one question each
Service providers
Measure transit and peering on your own side at the same 95th percentile you're billed for.
Network teams
The campus and the WAN in one place, with the port-level detail to settle an argument about which application filled a link.
Security teams
Many networks and a lot of traffic. Find a host, and see the conversation it had, down to the individual flow records.
Cloud-heavy estates
The VPCs and transit gateways where the traffic never touches a switch you own, analysed alongside the traffic that does.
Pricing
Point an exporter at it and see what your network has been doing
Flow Collector License
$299/mo$2,990/yr
- Unlimited exporters and devices
- Unlimited sites and clouds
- Unlimited users and interfaces
- Starting at 10,000 flows/s
- Self-hosted, air-gap ready